


Data Handling Using Pandas - Dataframes #2 - vol. 2
Let understand dataframes more deeply.


Hello reader, in my data handling using Pandas vol. 1 where we talked about data analysis, some basics of dataframes, series, etc. So, now let's understand dataframes more deeply.
Now, what comes in your mind when you think of a dataframe? So, basically DataFrame is a 2D labeled heterogeneous, data-mutable and size-mutable array which is widely used and is one of the most important data structures. The data in DataFrame is aligned in a tabular fashion in rows and columns therefore has both a row and column labels. Each column can have a different type of value such as numeric, string, boolean, etc
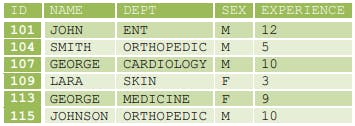
The above table describes data of doctors in the form of rows and columns. Here vertical subset are columns and horizontal subsets are rows. The column labels are Id, Name, Dept, Sex and Experience and row labels are 101, 104, 107, 109, 113 and 115.
So, let's take a look at the features/properties of dataframes :-
- Potentially columns are of different types
- Size – Mutable
- Labeled axes (rows and columns)
- Can Perform Arithmetic operations on rows and columns
CREATING DATAFRAME:-
A dataframe can be created using any of the following,
- Series
- Lists
- Dictionary
- A numpy 2D array
What syntax will now used by us to create a dataframe?
import pandas as pd
pd.dataframe( data, index, column)
where data: takes various forms like series, list, constants/scalar values, dictionary, another dataframe.
index: specifies index/row labels to be used for resulting frame. They are unique and hashable with same length as data. Default is np.arrange(n) if no index is passed.
column: specifies column labels to be used for resulting frame. They are unique and hashable with same length as data. Default is np.arrange(n) if no index is passed.
Creating An Empty Dataframe
An empty dataframe can be created as follows:
EXAMPLE 1:
Input,
import pandas as pd
dfempty = pd.DataFrame()
print (dfempty)
Output,
Empty DataFrame
Columns: []
Index: []
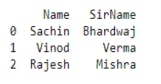
Now, let us create a dataframe from list of dictionaries
Input,
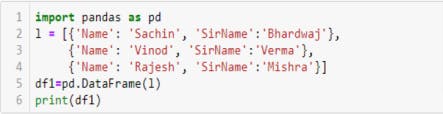
Output,
EXAMPLE 2:
Input,
import pandas as pd
l1=[{101:"Amit",102:"Binay",103:"Chahal"}, {102:"Arjun",103:"Fazal"}]
df=pd.DataFrame(l1)
print(df)
Output,
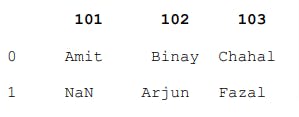
Explanation: Here, the dictionary keys are treated as column labels and row labels take default values starting from zero. The values corresponding to each key are treated as rows. The number of rows is equal to the number of dictionaries present in the list. There are two rows in the above dataframe as there are two dictionaries in the list. In the second row the value corresponding to key 101 is NaN because 101 key is missing in the second dictionary.
Note: If the value for a particular key is missing NaN (Not a Number) is inserted at that place.
Now, let us create a a dataframe from list of lists
EXAMPLE 3:
Input,
import pandas as pd
a=[[1,"Amit"],[2,"Chetan"],[3,"Rajat"],[4,"Vimal"]]
b=pd.DataFrame(a)
print(b)
Output,
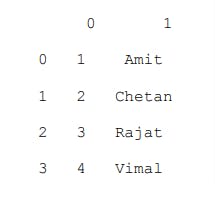
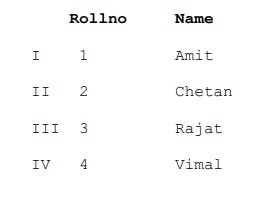
Here, row and column labels take default values. Lists form the rows of the dataframe. Column labels and row index can also be changed in the following way:
b=pd.DataFrame(a,index=[’I’,’II’,’III’,’IV’],columns=[‘Rollno’,’Name’])
Output,
Now let's take a look on how can dataframe created from dictionary of lists, EXAMPLE 4:
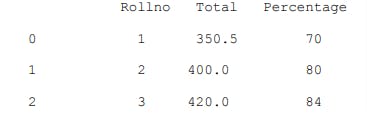
import pandas as pd
d1={"Rollno":[1,2,3], "Total":[350.5,400,420],
"Percentage":[70,80,84]}
df1=pd.DataFrame(d1)
print(df1)
Output,

Explanation: Here, the dictionary keys are treated as column labels and row labels take default values starting from zero.
Now let's create a dataframe from dictionary of series
Dictionary of Series can be passed to form a DataFrame. The resultant index is the union of all the series indexes passed.
EXAMPLE 5:
Input,
import pandas as pd
d2={"Rollno":pd.Series([1,2,3,4]), "Total":pd.Series([350.5,400,420]),
"Percentage":pd.Series([70,80,84,80])}
df2=pd.DataFrame(d2)
print(df2)
Output,
That's all for now reader. In next volume I will be sharing my insights over Customizing labels/ Changing index & column labels. Stay tuned for vol.3 🤞